Ceci est une ancienne révision du document !
Représentation 3D du pH
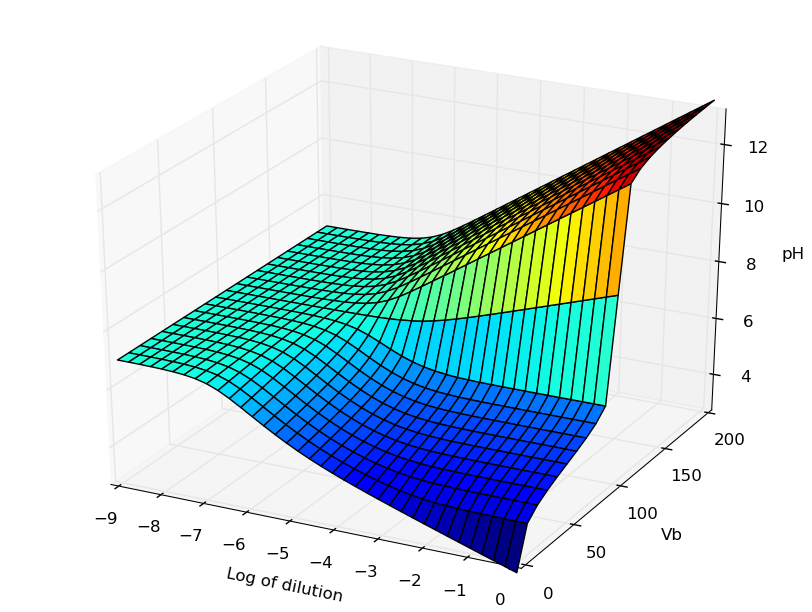
Cas d'un acide en fonction d'un ajout de base et d'une dilution globale : cf. cet article
<sxh python; title : pH-3D_topo-01.py> #! /usr/bin/env python # -*- coding: utf-8 -*- “”“ Use of numpy polynomes to compute pH of weak acid and strong base
3D topographic surface generation in the same conditions as the following paper : 3-D Surface Visualization of pH Titration “Topos”: Equivalence Point Cliffs, Dilution Ramps, and Buffer Plateaus” Garon C. Smith, Md Mainul Hossain and Patrick MacCarthy J. Chem. Educ., 2014, 91 (2), pp 225–231 DOI: 10.1021/ed400297t see fig here : http://pubs.acs.org/doi/abs/10.1021/ed400297t
Python code under GPLv3 GNU General Public License http://www.gnu.org/licenses/gpl-3.0.html
Didier Villers, UMONS http://dvillers.umons.ac.be/blog/contact/ “”“ import numpy as np import numpy.polynomial.polynomial as poly import matplotlib.pyplot as plt from mpl_toolkits.mplot3d import * # Axes3D from matplotlib import cm # Colors
def pH_monoprotic_acid(log10dil,Vb):
  # this Python function operate on numbers and cannot be applied on ndarrays due to the polynomial roots search
  dil=10**log10dil
  Ca=Ca0*dil
  Cb=Cb0*dil
  # http://docs.scipy.org/doc/numpy/reference/generated/numpy.polynomial.polynomial.polyroots.html#numpy.polynomial.polynomial.polyroots
  # http://docs.scipy.org/doc/numpy/reference/generated/numpy.polynomial.polynomial.polyval.html#numpy.polynomial.polynomial.polyval
  p=np.array([-Ka*Kw,-Kw-Ka*(Ca*Va-Cb*Vb)/(Va+Vb),Ka+(Cb*Vb)/(Va+Vb),1])
  x=poly.polyroots(p)
  y = poly.polyval(x,p)
  return float(-np.log10(x[np.where(abs(x-27.5)<27.5)]))  # only significant [H+] is returned
Ka=1.75E-5 # acid constant (acetic acid) Kw=1.E-14 # water product Ca0=1. # acid concentration Cb0=1. # base concentration Va=0.1 # volume of acid Vb=0. # volume of added base log10dil=0 print pH_monoprotic_acid(log10dil,Vb) # sample call
fig = plt.figure() ax = Axes3D(fig) X,Y = np.linspace(-9.,0.,36), np.linspace(0.,200.,21) print type(X), X.ndim, X.shape, X.dtype print type(Y), Y.ndim, Y.shape, Y.dtype Xc, Yc = np.meshgrid(X, Y) Z = Xc+Yc # just to create Z print type(Xc), Xc.ndim, Xc.shape, Xc.dtype print type(Yc), Yc.ndim, Yc.shape, Yc.dtype print type(Z), Z.ndim, Z.shape, Z.dtype print range(len(X)) for ix in range(len(X)):
  for iy in range(len(Y)):
      # print ix, iy,X[ix],Y[iy],pH_monoprotic_acid(X[ix],1E-3*Y[iy])
      Z[iy][ix] = pH_monoprotic_acid(X[ix],1E-3*Y[iy])
ax.plot_surface(Xc,Yc,Z, rstride=1,cstride=1,cmap=cm.jet) ax.set_xlabel('Log of dilution') ax.set_ylabel('Vb') ax.set_zlabel('pH') plt.show() </sxh>
La figure obtenue avec la librairie 3D de MatPlotlib peut être manipulée (zoom, rotations). En voici une image correspondant à la figure de l'article référencé dans Journal of Chemical Education :
