Table des matières
Surface d'énergie potentielle
Historique
Eyring et Polanyi ont publié en 1931 l'article On Simple Gas Reactions dans lequel ils décrivent les trajets des atomes dans la réaction H2 + H –> H + H2 (échange d'atomes). Ces travaux aboutiront au développement des notions de complexe activé (activated complex) ou état de transition (transition state).
Représentation graphique
L'article “On a New Method of Drawing the Potential Energy Surface” (Shin Sato, J. Chem. Phys. 23, 592, 1955) présente une simplification relativement facile à mettre en oeuvre dans le cas où les 3 atomes d'hydrogène sont alignés.
Des expression analytiques sont proposées pour un état d'énergie liant et un état d'énergie non-liant :
- $E_{bond}= D_e [\exp(-2\beta(r-r_e))-2\exp(-\beta(r-r_e))]$
- $E_{ant}= \frac{D_e}{2} [\exp(-2\beta(r-r_e))+2\exp(-\beta(r-r_e))]$
$r_e$ est la distance interatomique d'équilibre de H2, $D_e$ la profondeur du puits de potentiel et $\beta$ un paramètre pour ajuster sa largeur (voir le Potentiel de Morse, et l'approximation harmonique).
Pour 2 atomes d'hydrogène A et B, une approximation est :
- $E_{bond}= \frac{Q_{AB}+\alpha_{AB}}{1+S^2_{AB}} = \frac{Q_{AB}+\alpha_{AB}}{1+k}$
- $E_{ant}= \frac{Q_{AB}-\alpha_{AB}}{1-S^2_{AB}} = \frac{Q_{AB}-\alpha_{AB}}{1-k}$
Où $k=S^2_{AB}$ et $Q_{AB}$, $\alpha_{AB}$ et $S_{AB}$ sont respectivement les intégrales de coulomb, d'échange et de recouvrement, toutes fonctions de la distance $r_{AB}$ entre les atomes A et B.
La solution proposée par Sato pour 3 atomes A, B, C, avec l'hypothèse $S^2_{AB}=S^2_{BC}=S^2_{CA}=k$ est :
- $E = \frac{1}{1+k} \{ Q_{AB} + Q_{BC} + Q_{CA} - \sqrt{\frac{2}{1}[(\alpha_{AB} - \alpha_{BC})^2 + (\alpha_{BC} - \alpha_{CA})^2 + (\alpha_{CA} - \alpha_{AB})^2 ]} \}$
On obtient facilement $Q_{AB}$ et $\alpha_{AB}$ :
- $Q_{AB} = ((1+k)E_{bond} + (1-k)E_{ant}) / 2$
- $\alpha_{AB} = ((1+k)E_{bond} - (1-k)E_{ant}) / 2$
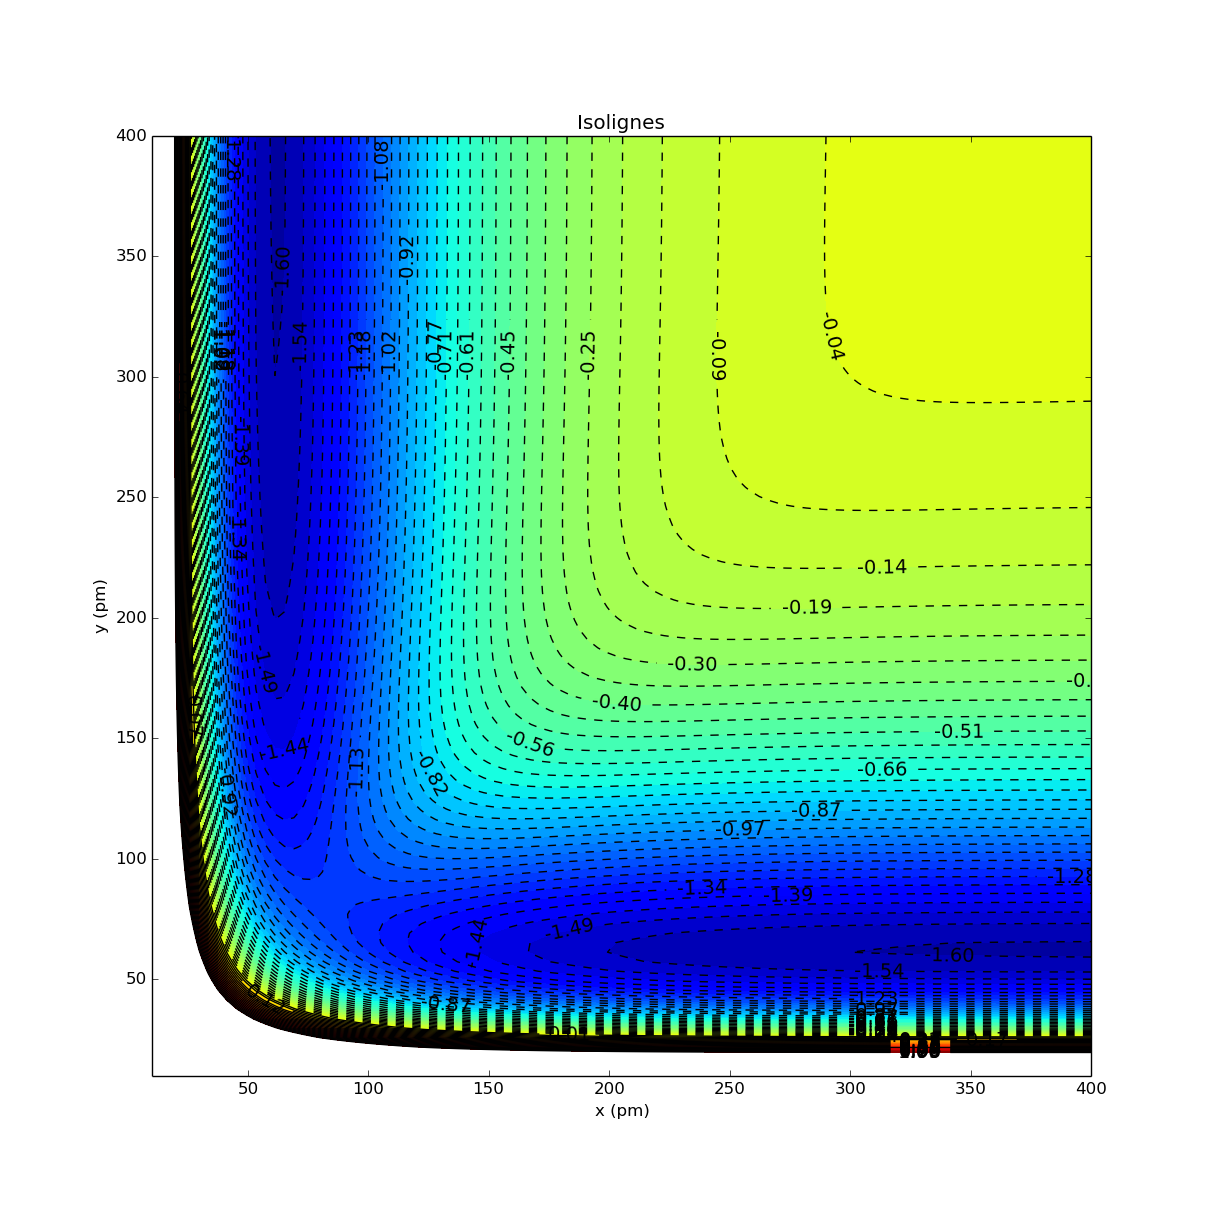
Sato présente des PES avec l'hypothèse k = 0.18 pour des distances jusque 0.5 nm.
Programme
- PES-contour-01.py
#!/usr/bin/env python
# -*- coding: utf-8 -*-
"""
Tracés de lignes de niveau ou isolignes
Application : Potentiel Energy Surface de la réaction
H + H2 --> H2 + H

"""
# ref : http://bulldog2.redlands.edu/facultyfolder/deweerd/tutorials/Tutorial-ContourPlot.pdf

import matplotlib.pyplot as plt  # directive d'importation standard de Matplotlib
import numpy as np               # directive d'importation standard de numpy
from mpl_toolkits.mplot3d import Axes3D  # Axes3D

def Ebond(rAB):
    return D_e * (np.exp(-2.*beta*(rAB-r_e)) - 2.*np.exp(-beta*(rAB-r_e)))
def Eant(rAB):
    return 0.5 * D_e * (np.exp(-2.*beta*(rAB-r_e)) + 2.*np.exp(-beta*(rAB-r_e)))
def Q(rAB):
    return 0.5 * ((1.+k)*Ebond(rAB) + (1.-k)*Eant(rAB))
def a(rAB):
    return 0.5 * ((1.+k)*Ebond(rAB) - (1.-k)*Eant(rAB))

beta=19.3E-3 # pm-1
r_e=74.1 # pm
D_e = .76 # E-18 J
k=0.18
rmin=10.
rmax=400.
num=100
x_1d = np.linspace(rmin,rmax, num)
print x_1d.shape, x_1d.dtype, x_1d.ndim
y_1d = np.linspace(rmin,rmax, num)
print y_1d.shape, y_1d.dtype, y_1d.ndim
X, Y = np.meshgrid(x_1d, y_1d)
print X.shape, X.dtype, X.ndim, Y.shape, Y.dtype, Y.ndim
E=(Q(X)+Q(Y)+Q(X+Y)-np.sqrt(2.*( (a(X)-a(Y) )**2.+(a(Y)-a(X+Y) )**2.+(a(X+Y)-a(X) )**2.) ))/(1.+k)
print np.min(E)  #valeur minimale de E

fig = plt.figure(figsize=(12, 12), dpi=80)
ax = fig.add_subplot(111)
# cf. http://stackoverflow.com/questions/7965743/how-can-i-set-the-aspect-ratio-in-matplotlib
ax.set_aspect("equal")
levels = np.linspace(-1.7, 1.0, 53)
CS1 = plt.contour(X, Y, E, levels, colors='k')
plt.clabel(CS1, colors = 'k', fmt = '%2.2f', fontsize=14)
CS2 = plt.contourf(X, Y, E, levels)
#plt.colorbar(CS2)  # visualisation éventuelle de l'échelle de couleur

plt.title('Isolignes')
plt.xlabel('x (pm)')
plt.ylabel('y (pm)')

fig = plt.figure(2,figsize=(15, 15) )
ax = Axes3D(fig)
ax.plot_surface(X,Y,E, rstride=1,cstride=1 ,cmap=plt.cm.jet)
ax.set_xlabel('X')
ax.set_ylabel('Y')
ax.set_zlabel('E')
plt.show()
Avec les paramètres essayés, la valeur minimale de E est environ -1.603
Sorties graphiques
Lignes de contour
Surface 3D
Références
- http://www.wag.caltech.edu/home/jsu/Summary/GroundStateExamples.html (réaction H2 + H)
- http://www.personal.psu.edu/jba/publications/articles/23.pdf (HF + H –> H2 + F)
- On a New Method of Drawing the Potential Energy Surface, Shin Sato, J. Chem. Phys. 23, 592 (1955)
- Introduction to potential energy surfaces and graphical interpretation, Ralph Jaquet (2002)
- QUANTENMECHANISCHE DEUTUNG DES VORGANGS DER AKTIVIERUNG F. London Zeitschrift für Elektrochemie und angewandte physikalische Chemie. Volume 35, Issue 9, pages 552–555, September 1929
- W H Miller, Recent Advances in Quantum Mechanical Reactive Scattering Theory, Including Comparison of Recent Experiments with Rigorous Calculations of State-to-State Cross Sections for the H/D+H2→H2/HD+H Reactions, Annual Review of Physical Chemistry, Vol. 41: 245-281 (Volume publication date October 1990) DOI: 10.1146/annurev.pc.41.100190.001333
- Peterson, Kirk A., Woon, David E., Dunning, Thom H. , Benchmark calculations with correlated molecular wave functions. IV. The classical barrier height of the H+H2→H2+H reaction, Journal of Chemical Physics. 5/15/1994, Vol. 100 Issue 10, p7410
Voir aussi :
- Let Students Derive, by Themselves, Two-Dimensional Atomic and Molecular Quantum Chemistry from Scratch, Yingbin Ge, J. Chem. Educ., 2016, 93 (12), pp 2033–2039 DOI: 10.1021/acs.jchemed.6b00572

