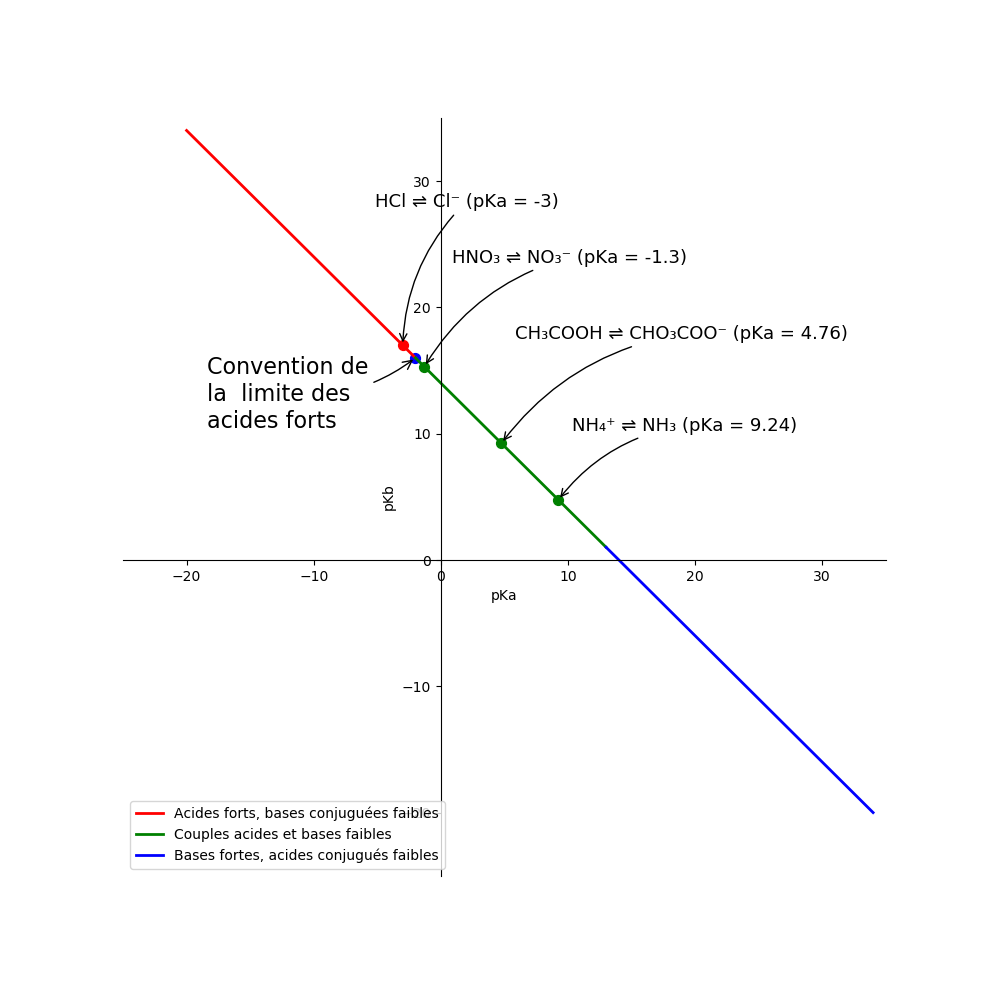
Couples acide-base dans le plan pKa/pKb
- Conventions sur les acides forts et les bases fortes : cf. Les acides, les bases et les sels qui nous entourent - Acide fort, base forte
- droite_pKa-pKb-01.py
#!/usr/bin/env python3
# -*- coding: utf-8 -*-

"""
Library references :
  *

"""
import matplotlib.pyplot as plt  # directive d'importation standard de Matplotlib
import numpy as np               # directive d'importation standard de numpy

def cm2inch(*tupl):
    # https://stackoverflow.com/questions/14708695/specify-figure-size-in-centimeter-in-matplotlib
    inch = 2.54
    if isinstance(tupl[0], tuple):
        return tuple(i/inch for i in tupl[0])
    else:
        return tuple(i/inch for i in tupl)

pKasa = np.linspace(-20, -2, 19, endpoint=True) # strong acid
pKa = np.linspace(-2, 13, 16, endpoint=True)
pKasb = np.linspace(13, 34, 22, endpoint=True) # strong base
pKbsa = 14 - pKasa
pKb = 14 - pKa
pKbsb = 14 - pKasb

plt.figure(figsize=cm2inch(25., 25.))
ax1 = plt.subplot(1, 1, 1)


plt.plot(pKasa, pKbsa, color="red", linewidth=2.0, linestyle="-", label="Acides forts, bases conjuguées faibles")
plt.plot(pKa, pKb, color="green", linewidth=2.0, linestyle="-", label="Couples acides et bases faibles")
plt.plot(pKasb, pKbsb, color="blue", linewidth=2.0, linestyle="-", label="Bases fortes, acides conjugués faibles")

plt.xlim(-25.0, 35.0)
plt.xticks(np.linspace(-20, 30, 6, endpoint=True))
plt.ylim(-25.0, 35.0)
plt.yticks(np.linspace(-20, 30, 6, endpoint=True))
plt.xlabel("pKa")
plt.ylabel("pKb")
plt.legend(loc='lower left')

ax = plt.gca()  # gca stands for 'get current axis'
ax.spines['right'].set_color('none')
ax.spines['top'].set_color('none')
ax.xaxis.set_ticks_position('bottom')
ax.spines['bottom'].set_position(('data',0))
ax.yaxis.set_ticks_position('left')
ax.spines['left'].set_position(('data',0))

x = -2
# plt.plot([x, x], [0, 14-x], color='blue', linewidth=2.5, linestyle="--")
plt.scatter([x, ], [14-x, ], 50, color='blue')
plt.annotate('Convention de\nla  limite des\nacides forts',
            xy=(x, 14-x), xycoords='data',
            xytext=(-150, -50), textcoords='offset points', fontsize=16,
            arrowprops=dict(arrowstyle="->", connectionstyle="arc3,rad=.2"))

plt.scatter([-3, ],[17, ], 50, color='red')
plt.annotate('HCl ⇌ Cl⁻ (pKa = -3)',
             xy=(-3, 17), xycoords='data',
             xytext=(-20, +100), textcoords='offset points', fontsize=13,
             arrowprops=dict(arrowstyle="->", connectionstyle="arc3,rad=.2"))

plt.scatter([-1.3, ],[15.3, ], 50, color='green')
plt.annotate('HNO₃ ⇌ NO₃⁻ (pKa = -1.3)',
             xy=(-1.3, 15.3), xycoords='data',
             xytext=(+20, +75), textcoords='offset points', fontsize=13,
             arrowprops=dict(arrowstyle="->", connectionstyle="arc3,rad=.2"))

plt.scatter([4.76, ],[9.24, ], 50, color='green')
plt.annotate('CH₃COOH ⇌ CHO₃COO⁻ (pKa = 4.76)',
             xy=(4.76, 9.24), xycoords='data',
             xytext=(+10, +75), textcoords='offset points', fontsize=13,
             arrowprops=dict(arrowstyle="->", connectionstyle="arc3,rad=.2"))

plt.scatter([9.24, ],[4.76, ], 50, color='green')
plt.annotate('NH₄⁺ ⇌ NH₃ (pKa = 9.24)',
             xy=(9.24, 4.76), xycoords='data',
             xytext=(+10, +50), textcoords='offset points', fontsize=13,
             arrowprops=dict(arrowstyle="->", connectionstyle="arc3,rad=.2"))


plt.savefig("pKa-pKb-plane-01.png")
plt.show()
La figure obtenue :
