pH et courbe de titrage
- pH_courbe_titrage.py
#!/usr/bin/env python
# -*- coding: utf-8 -*-
# Programme de calculs de pH et de courbes de titrages
# AD & BW, Ba2 chimie 2010-2011

from math import *
from Tkinter import *
import matplotlib.pyplot as plt
import numpy as np

def pol():                            #on définit la fonction pour le bouton "Calcul du pH"
    try:
        ca = e0.get()                 #permet de récupérer les valeurs entrées dans les champs d'entrée par l'utilisateur
        pka =e1.get()
        equation_index = myvar.get()  #permet de déterminer quel radioboutton est sélectionné
        if equation_index == 0:       #si aucun des radios bouttons n'est sélectionné on crée une fonction ouvrant une fenêtre d'avertissement
            fenwarn = Toplevel(fen1)
            fenwarn.title('Erreur')
            Label(fenwarn, text='Vous devez choisir un type').pack(padx=5, pady=5)
            Button(fenwarn, text='Fermer', command = fenwarn.destroy,bg="red").pack(padx=5, pady=5)
            return
        elif equation_index == 1:     #valeur attribuée aux différents radio bouttons
            rep=0.5*(float(pka))-0.5*log10(float(ca))
        elif equation_index == 2:
            rep=7+0.5*(float(pka))+0.5*log10(float(ca))
        elif equation_index == 3:
            rep=-log10(float(ca))
        elif equation_index == 4:
            rep=14+log10(float(ca))
        if rep<0 or rep>14:
            fenwarn = Toplevel(fen1)
            fenwarn.title('Erreur')
            Label(fenwarn, text="Veuillez entrer des valeurs cohérentes. Le pH doit-être compris entre 0 et 14").pack(padx=5, pady=5)
            Button(fenwarn, text='Fermer', command = fenwarn.destroy,bg="red").pack(padx=5, pady=5)
            print "Attention!!! Le ph n'est pas compris entre 0 et 14"
            return

    except ValueError, TypeError:
        fenwarn = Toplevel(fen1)
        fenwarn.title('Erreur')
        Label(fenwarn, text="Veuillez entrer une donnée cohérente!").pack(padx=5, pady=5)
        Label(fenwarn, text="Si cette dernière est décimale, n'oubliez pas le point à la place de la virgule").pack(padx=5, pady=5)
        Button(fenwarn, text='Fermer', command = fenwarn.destroy,bg="red").pack(padx=5, pady=5)
        print """Veuillez entrer une donnée cohérente.\nSi cette dernière est décimale, n'oubliez pas le point à la place de la virgule"""  #coller Si au /n sinon, on a un espace qui se met dans l'interpréateur.
    else:
        print"Voici le resultat, pour une concentration de",ca, "mol/l et un pka de",pka," le ph est de",rep #on imprime la réponse dans le mode interactif
        Result['text'] = "Resultat : " + str(rep)

def graphe():
    x=np.arange(0,50)
    y=((5*(1/(0.5+e**-(x-25))))+1)
    plt.plot(x,y)
    plt.xlim(0,50)
    plt.ylim(0,14)
    plt.ylabel('pH')
    plt.xlabel("Volume")
    plt.suptitle("Exemple de courbe de titrage: titrage d'un acide fort par une base forte")
    plt.show()

def bye():                          #fonction du bouton Fermer qui ferme la fenêtre
    print "Merci d'avoir utilisé notre programme, à la prochaine!"
    fen1.destroy()

def titrage():                      #fonction du bouton Courbe de titrage
    fen = Toplevel(fen1)
    fen.title('Courbe de titrage')
    Button(fen, text='Fermer', command = fen.destroy,bg="red").pack(padx=5, pady=5)

fen1 = Tk()
fen1.title("Calculs de pH")

#création des différents widgets (Radioboutons, boutons, champs d'entrée)

myvar= IntVar()

Label(fen1, text="Quel est le type de l'espèce considérée ?").grid(row=0, column=1, columnspan=2, padx=5, pady=5)
Radiobutton(fen1,text="Acide faible", variable=myvar, value=1, indicatoron=0, bg="red", fg="black").grid(row=1, column=1, padx=5, pady=5, ipady=5, sticky=W+E)
Radiobutton(fen1,text="Base faible ", variable=myvar, value=2, indicatoron=0, bg="blue", fg="cyan").grid(row=2, column=1, padx=5, pady=5, ipady=5, sticky=W+E)
Radiobutton(fen1,text="Acide fort", variable=myvar, value=3, indicatoron=0, bg="red", fg="black").grid(row=1, column=2, padx=5, pady=5, ipady=5, sticky=W+E)
Radiobutton(fen1,text="Base forte", variable=myvar, value=4, indicatoron=0, bg="blue", fg="cyan").grid(row=2, column=2, padx=5, pady=5, ipady=5, sticky=W+E)

Label(fen1, text="Concentration de l'espèce en question (en mol/l) :").grid(row=0, column=3, padx=5, pady=5)
e0=Entry(fen1, width=20, justify=CENTER)
e0.grid(row=1, column=3)
Label(fen1, text="pka ?").grid(row=2, column=3)
e1=Entry(fen1, width=20, justify=CENTER)
e1.grid(row=3, column=3)

Button(fen1, text="Calcul du pH", command=pol, bg="green", fg="black", relief=GROOVE).grid(row=4, column=3, pady=15)
Button(fen1, text="Quitter", command=bye, bg="red").grid(row=9, column=1, columnspan=3, padx=5, pady=5)
Button(fen1, text="Courbe de titrage", command=graphe, bg="black", fg="white").grid(row=4, column=1,columnspan=2, padx=5, pady=5)

#création d'un widget 'Canvas' contenant une image bitmap :

can1 = Canvas(fen1, width =370, height =600, bg ='white')
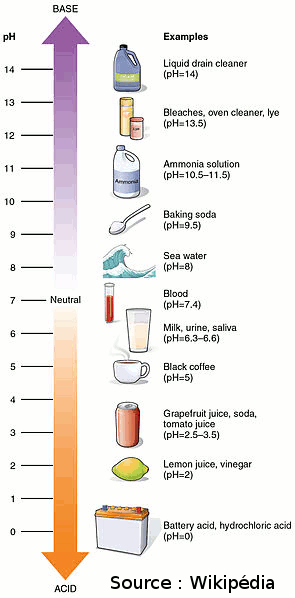
photo = PhotoImage(file ='216_pH_Scale-01.gif')
item = can1.create_image(185, 300, image =photo)
can1.grid(row=5, columnspan=5, padx=10, pady=10)

#création de ligne de séparation

Frame(fen1, height=2, bd=1, relief=SUNKEN).grid(row=6, column=1, columnspan=3, padx=5, pady=5, sticky=W+E)
Frame(fen1, height=2, bd=1, relief=SUNKEN).grid(row=8, column=1, columnspan=3, padx=5, pady=5, sticky=W+E)

#emplacement du résultat

Result = Label(fen1, text="Résultat :", justify=CENTER)
Result.grid(row=7, column=1, columnspan=3, padx=5, pady=5, sticky=W+E)

#exécution du programme

fen1.mainloop()

#Sources
#http://matplotlib.sourceforge.net/
#http://www.scipy.org/Plotting_Tutorial
#http://www.pythonware.com/library/tkinter/introduction/
#http://gnuprog.info/prog/python/pwidget.php
#http://www.inforef.be/swi/python.htm (PDF Swinnen)
#http://en.wikipedia.org/wiki/File:216_pH_Scale-01.jpg <-- image remplaçant celle proposée par les étudiants
Image utilisée :
